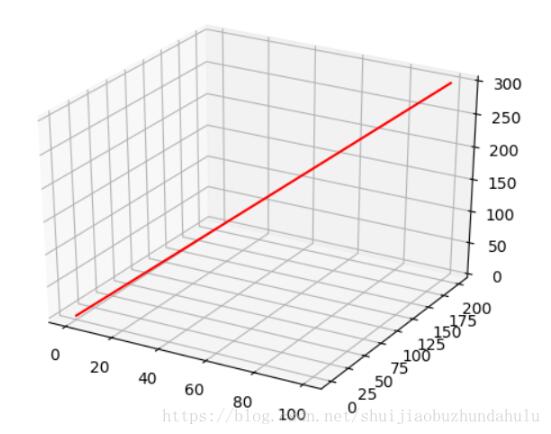
如下所示:
from mpl_toolkits.mplot3d import axes3d
import matplotlib.pyplot as plt

# 打开画图窗口1,在三维空间中绘图
fig = plt.figure(1)
ax = fig.gca(projection='3d')

# 给出点(0,0,0)和(100,200,300)
x = [0, 100]
y = [0, 200]
z = [0, 300]

# 将数组中的前两个点进行连线
figure = ax.plot(x, y, z, c='r')
plt.show()
运行结果如下
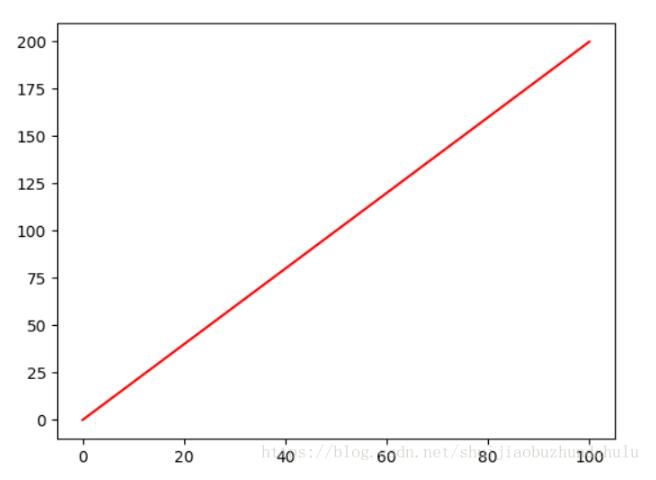
在二维空间中,我们只需要修改
fig.gca(projection='3d')为fig.gca()
示例如下:
from mpl_toolkits.mplot3d import axes3d
import matplotlib.pyplot as plt

# 打开画图窗口1,在三维空间中绘图
fig = plt.figure(1)
ax = fig.gca()

# 给出点(0,0,0)和(100,200,300)
x = [0, 100]
y = [0, 200]
z = [0, 300]

# 将数组中的前两个点进行连线
figure = ax.plot(x, y ,c='r')
plt.show()
结果如下: