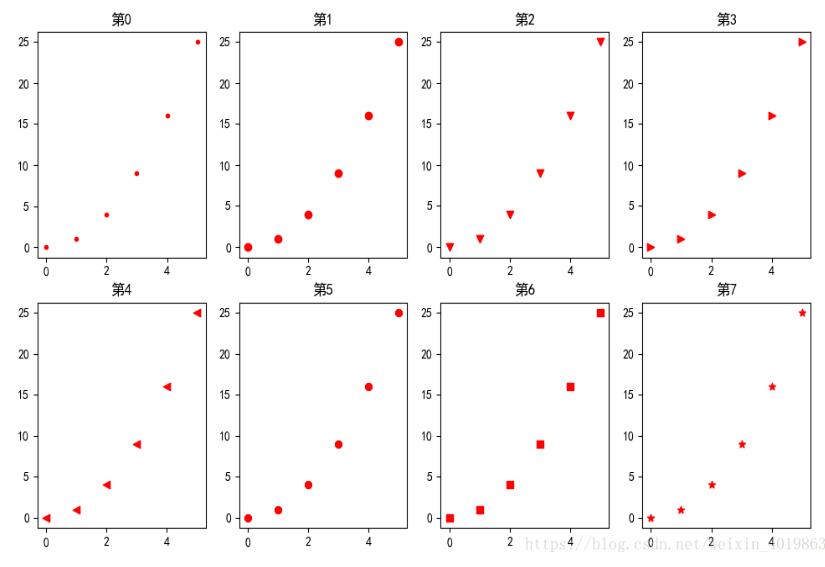
绘制八个子图
import matplotlib.pyplot as plt

fig = plt.figure()

shape=['.','o','v','>','<','8','s','*']
for j in range(8):
  x=[i for i in range(6)]
  y=[i**2 for i in range(6)]
  ax = fig.add_subplot(241+j)
  ax.scatter(x,y,c='r',marker=shape[j])
  ax.set_title('第'+str(j))
plt.show()